Ocean Observatory Initiative News Feed
News from Ocean Observatory Initiative
A new era of oceanography

-
Why OOI Matters on World Oceans Day
Dear OOI Community, Today, on World Oceans Day, we join scientists, educators, policymakers, and citizens around the globe to recognize the ocean’s critical role in sustaining life on Earth. From regulating climate to supporting biodiversity, the ocean is at the heart of our planet’s health and understanding it has never been more urgent. That’s where the Ocean Observatories Initiative (OOI) comes into play. For over a decade, OOI has enabled transformative ocean science by delivering open, continuous, research-quality data from some of the most dynamic and remote marine environments. Our coastal, global, and cabled arrays provide essential data that fuels research on everything from climate variability to marine heatwaves, earthquakes, ocean acidification, and more. OOI data supports students in classrooms, early-career researchers, seasoned scientists, and international partners. But this World Oceans Day arrives with a tremendous amount of uncertainty. As you may know, the President’s FY2026 budget request for the National Science Foundation (NSF) proposes severe cuts to OOI funding, up to 80%, along with language signaling possible decommissioning. These cuts would effectively end our ability to deploy sensors, maintain arrays, and collect new data. It would mark a significant loss for the ocean science community, especially at a time when sustained ocean observations are more important than ever. Despite these challenges, our mission remains clear: support ocean discovery, empower data-driven research, and serve the broader public good. We continue to carry out fieldwork and deliver data that advances science every day. On this World Oceans Day, we invite you to explore OOI data, share your stories of how you use it, and help us raise awareness by using #OOIDataMatters on social media. Let’s reaffirm why long-term ocean observation is a public investment that’s worth protecting. Thank you for being part of this community. We will share updates as new information becomes available. With appreciation, Jim Edson -
Advancing Mooring Technology for Long-Term Ocean Observation
Advances in oceanographic mooring technology are critical to sustaining long-term, high-quality observations in some of the planet’s harshest environments. Moorings must now operate reliably over extended deployments, support increasingly sophisticated instrumentation, and withstand the growing impacts of extreme weather. To better understand recent progress and ongoing challenges in this field, we spoke with Alex Franks, Research Engineer at Woods Hole Oceanographic Institution (WHOI) and a key contributor to the Ocean Observatories Initiative (OOI). Over the past three years, Franks and his team have introduced significant upgrades to OOI infrastructure - most notably enhancements in satellite telemetry, power generation and management systems, and the structural resilience of both surface and subsurface moorings. These improvements aim not only to extend deployment lifetimes and reduce maintenance needs but also to expand the scientific capabilities of moorings by accommodating higher-bandwidth data streams and more energy-intensive instruments. This Q&A offers a detailed look at the evolving strategies behind mooring system engineering and the practical steps being taken to meet both scientific demands and environmental challenges.- In the last 3 years, what have been the most notable improvements in remotely diagnosing and fixing mooring issues?
- What new features are you currently developing to further improve mooring system reliability?
- Looking ahead, what do you see as the next major breakthrough in mooring technology?
- Are there any upcoming field tests or deployments that you're particularly excited about?
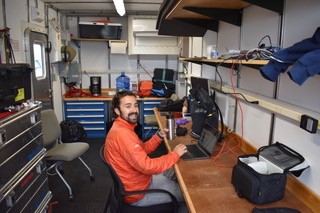 Compass characterization procedure at the LOSOS building. Pictured: Alex Franks, WHOI[/caption]
 -
Open Access, Open Ocean: Marking 75 Years of NSF Through Sustained Ocean Observation
This week, the OOI joins the scientific community in celebrating the 75th anniversary of the U.S. National Science Foundation (NSF). This milestone marks decades of national investment in science, innovation, and public benefit. OOI exists because of NSF’s vision and support. Our mission, delivering long-term, openly accessible ocean data, reflects a shared commitment to expanding scientific knowledge and ensuring that access to that knowledge is equitable, inclusive, and available to all. Open Access Data: A Shared Commitment The NSF’s mission is rooted in the belief that the progress of science should benefit all and be free from barriers to participation. OOI carries this forward through its core function: providing open access to high-resolution oceanographic data collected from some of the most remote and dynamic regions of the ocean. OOI’s infrastructure, which spans cabled, coastal, and global sites, captures continuous, multi-dimensional data on key ocean processes. This data, ranging from temperature and salinity to seafloor seismic activity, is made freely available in near real time to anyone: scientists, educators, students, and the public. For both OOI and NSF, access to data isn’t just a technical feature, it’s a fundamental value. Transparency, inclusivity, and public benefit are central to how we operate. Investing in Infrastructure NSF invests in strengthening the nation's ability to conduct research and turn scientific insights into benefits for society. OOI supports this by maintaining a robust, continuously operating network of ocean sensors and platforms. This infrastructure enables:- Collaborative research across institutions and disciplines
- Technology testing and innovation in extreme marine environments
- Educational engagement using real-world datasets
- Data-driven decision-making on ocean and climate issues
-
Salinification of the Cold Pool on the New England Shelf
(Adapted from Taenzer et al., 2025) The continental shelf within the Mid-Atlantic Bight is cooled and mixed vertically in the winter. This relatively cold, fresh water is trapped below the seasonally-warming surface layer, retaining its properties as a subsurface “cold pool” throughout most of the spring and summer. The cold pool is important for regional ecosystems, serving as a cold-water habitat and a nutrient reservoir for the continental shelf. It is known that the cold pool warms and shrinks in volume as a result of advective fluxes and heat exchange with surrounding waters. A recent paper by Taenzer et al. (2025) shows for the first time that the cold pool is also subject to salt fluxes and increases significantly in salinity from April to October. The Pioneer New England Shelf (NES) inshore moorings (ISSM and PMUI) are positioned shoreward of the shelfbreak front and sample conditions on the outer continental shelf where the cold pool can be identified. The authors extracted data from these two moorings from a quality-controlled data set containing timeseries of hydrographic data (temperature, salinity and pressure) from all of the Pioneer NES moorings on a uniform space-time grid, covering the timeframe from January 2015 through May 2022 (Taenzer et al., 2023). The cold pool study used data from 2 m depth, 7 m depth, and 2 m above the bottom on ISSM and from roughly 28 m to 67 m depth on PMUI. Seven years of data from the Pioneer ISSM and PMUI moorings were used to create a composite annual cycle, which showed that subsurface salinity on the outer shelf consistently increases in the spring and summer. Evaluating the 67 m depth salinity record, and restricting the time period to when the moorings are in the cold pool, resulted in a salinification estimate of 0.18 PSU/month, or ~1 PSU over the six month period (Figure 34a). It was shown that this salinity change could not be explained by a seasonal change in the frontal position. Isolating the corresponding cold pool region within the New England Shelf and Slope (NESS) model (Chen and He, 2010), and computing a similar multi-year mean, showed a salinification trend nearly identical to that from the observations (Figure 34b). Using the model, it was possible to define a three-dimensional cold pool volume and estimate terms in the cold pool salinity budget. It was found that cross-frontal fluxes transport salt from offshore to the cold pool at a relatively steady rate throughout the year, and that along-shelf advection contributes little to the salinification process. It was argued that the cold pool exhibits two regimes that result in the seasonal salinification: During the winter, vertical mixing is strong, and the cold pool gets replenished with fresh water from the surface layer, which tends to balance the cross-shelf salt flux. During the spring and summer, surface stratification increases, vertical mixing is inhibited, the cold pool is effectively isolated from surface mixing, and the cross-shelf salt flux results in cold pool salinification. This project shows the importance of long-duration observations in key locations to isolate phenomena that would not be identifiable from a short-term process study. It is notable that the authors undertook a significant quality control effort and created a merged, depth-time gridded data set that was made publicly available. By combining the observations with a high-resolution regional model, the authors were able to examine the cold pool salinity budget and attribute the observed signals to ocean processes. [caption id="attachment_36391" align="alignnone" width="402"] Figure 34: The seven-year mean annual cycle of continental shelf cold pool salinity from a) Pioneer Array PMUI salinity at 67m depth, b) NESS model salinity for all waters below 10◦C along 70.875 W. The shaded envelope depicts one standard deviation of interannual variability. The salinification trend is from a linear fit during the stratified season (April-October). From Taenzer et al., 2025.[/caption]
___________________
References:
Chen, K., & He, R. (2010). Numerical investigation of the Middle Atlantic Bight Shelfbreak Frontal circulation using a high-resolution ocean hindcast model. J. Physical Oceanog., 40 (5), 949 - 964. doi:10.1175/2009JPO4262.1
Taenzer, L.L., G.G. Gawarkiewicz and A.J. Plueddemann, (2023). Gridded hydrography and bulk air-sea interactions observed by the Ocean Observatory Initiative (OOI) Coastal Pioneer New England Shelf Mooring Array (2015-2022) [data set], Woods Hole Oceanographic Inst., Open Access server, https://doi.org/10.26025/1912/66379.
Taenzer, L.L., K. Chen, A.J. Plueddemann and G.G. Gawarkiewicz, (2025). Seasonal salinification of the US Northeast Continental Shelf cold cool driven by imbalance between cross-shelf fluxes and vertical mixing. J. Geophys. Res., accepted.
Figure 34: The seven-year mean annual cycle of continental shelf cold pool salinity from a) Pioneer Array PMUI salinity at 67m depth, b) NESS model salinity for all waters below 10◦C along 70.875 W. The shaded envelope depicts one standard deviation of interannual variability. The salinification trend is from a linear fit during the stratified season (April-October). From Taenzer et al., 2025.[/caption]
___________________
References:
Chen, K., & He, R. (2010). Numerical investigation of the Middle Atlantic Bight Shelfbreak Frontal circulation using a high-resolution ocean hindcast model. J. Physical Oceanog., 40 (5), 949 - 964. doi:10.1175/2009JPO4262.1
Taenzer, L.L., G.G. Gawarkiewicz and A.J. Plueddemann, (2023). Gridded hydrography and bulk air-sea interactions observed by the Ocean Observatory Initiative (OOI) Coastal Pioneer New England Shelf Mooring Array (2015-2022) [data set], Woods Hole Oceanographic Inst., Open Access server, https://doi.org/10.26025/1912/66379.
Taenzer, L.L., K. Chen, A.J. Plueddemann and G.G. Gawarkiewicz, (2025). Seasonal salinification of the US Northeast Continental Shelf cold cool driven by imbalance between cross-shelf fluxes and vertical mixing. J. Geophys. Res., accepted. -
Subsurface Temperature Anomalies off Central Oregon during 2014–2021
Brandy T. Cervantes, Melanie R. Fewings, and Craig M. Risien Cervantes et al. (2024) use water temperature observations from a stationary oceanographic platform located in 80 m water depth off Newport, Oregon to calculate variations from the long term mean temperature at the surface, near surface, and bottom from 1999 to 2021. This site, known as NH-10, was occupied since 1999 successively by an Oregon State University National Oceanographic Partnership Program (OSU NOPP), GLOBEC Long Term Observation Program, Oregon Coastal Ocean Observing System (OrCOOS), NANOOS/CMOP. Since 2015 it has been occupied by the NSF OOI Coastal Endurance Oregon Shelf mooring (CE02SHSM). The temperature observations from these different programs that have not previously been combined into one long time series. Of particular interest are the details of the marine heatwave (MHW) periods of 2014–2016 and 2019– 2020, which had widespread impacts on marine ecosystems. Strong deviations from the mean water temperature observed near the ocean bottom during late 2016 are the largest sustained warm anomalies in the time series. The 2019–2020 period shows warm anomalies in the summer and fall that are only observed near the surface. They also analyze the local winds during years with and without MHWs and find that spring/summer upwelling favorable, or northerly winds, which are important for bringing cold, nutrient rich water to the surface in coastal regions, interrupt MHW events and can lessen extreme heating during MHWs in coastal waters as illustrated in Figure 33. The three periods detailed in Figure 33 show warmer daily surface temperatures during the MHW years than the non‐MHW years and several days during 2014–2016 with surface and bottom anomalies greater than 4°C and during 2014–2016 and 2019–2020 with surface anomalies greater than 4°C (Figure 12a). During upwelling favorable winds (negative wind stress), the three periods follow similar patterns with colder surface temperatures typically associated with higher wind stress magnitudes. During downwelling‐favorable winds (positive wind stress), 2014–2016 is substantially warmer at the surface than the other periods at all wind stress values. [caption id="attachment_36388" align="alignnone" width="526"] Figure 33: 8‐Day low‐pass filtered surface temperature at NH‐10/CE02SHSM for (a) 1999–2000, (d) 2014–2015, and (g) 2019–2020; 8‐day low‐pass filtered along‐shelf surface velocity for (b) 1999–2000, (e) 2014–2015, and (h) 2019–2020; and NDBC 46050 wind stress vectors (thin light lines) and along‐shelf 8‐day wind stress (thick lines) (c) 1999–2000, (f) 2014–2015, and (i) 2019–2020. Events identified as surface marine heatwaves are shaded in gray. The thick black line in panels (a–b), (d–e), and (g–h) is the climatological mean computed over the full NH‐10 time series (Figure 33c), repeated twice, and the thin black lines are the 90th and tenth percentiles.[/caption]
___________________
References:
Cervantes, B. T., Fewings, M. R., & Risien, C. M. (2024). Subsurface temperature anomalies off central Oregon during 2014–2021. Journal of Geophysical Research: Oceans, 129, e2023JC020565. https://doi.org/10.1029/2023JC020565
Figure 33: 8‐Day low‐pass filtered surface temperature at NH‐10/CE02SHSM for (a) 1999–2000, (d) 2014–2015, and (g) 2019–2020; 8‐day low‐pass filtered along‐shelf surface velocity for (b) 1999–2000, (e) 2014–2015, and (h) 2019–2020; and NDBC 46050 wind stress vectors (thin light lines) and along‐shelf 8‐day wind stress (thick lines) (c) 1999–2000, (f) 2014–2015, and (i) 2019–2020. Events identified as surface marine heatwaves are shaded in gray. The thick black line in panels (a–b), (d–e), and (g–h) is the climatological mean computed over the full NH‐10 time series (Figure 33c), repeated twice, and the thin black lines are the 90th and tenth percentiles.[/caption]
___________________
References:
Cervantes, B. T., Fewings, M. R., & Risien, C. M. (2024). Subsurface temperature anomalies off central Oregon during 2014–2021. Journal of Geophysical Research: Oceans, 129, e2023JC020565. https://doi.org/10.1029/2023JC020565